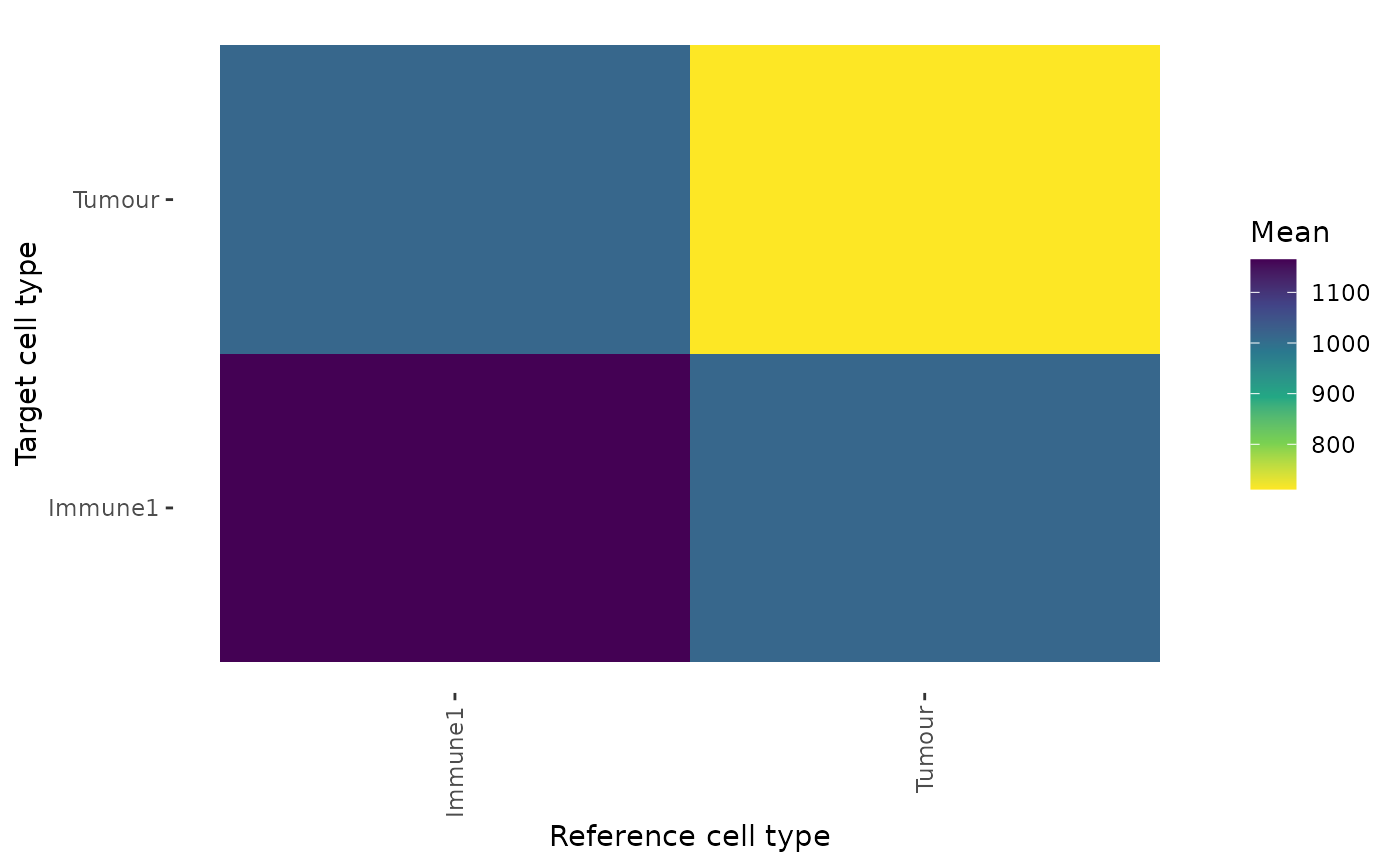
Takes the output of cell_distances and plot the distances as a heatmap.
plot_distance_heatmap(phenotype_distances_result, metric = "mean")Arguments
Value
A plot is returned
Examples
dists <- calculate_pairwise_distances_between_celltypes(SPIAT::defined_image,
cell_types_of_interest = c("Tumour","Immune1"), feature_colname = "Cell.Type")
summary_distances <- calculate_summary_distances_between_celltypes(dists)
plot_distance_heatmap(summary_distances)