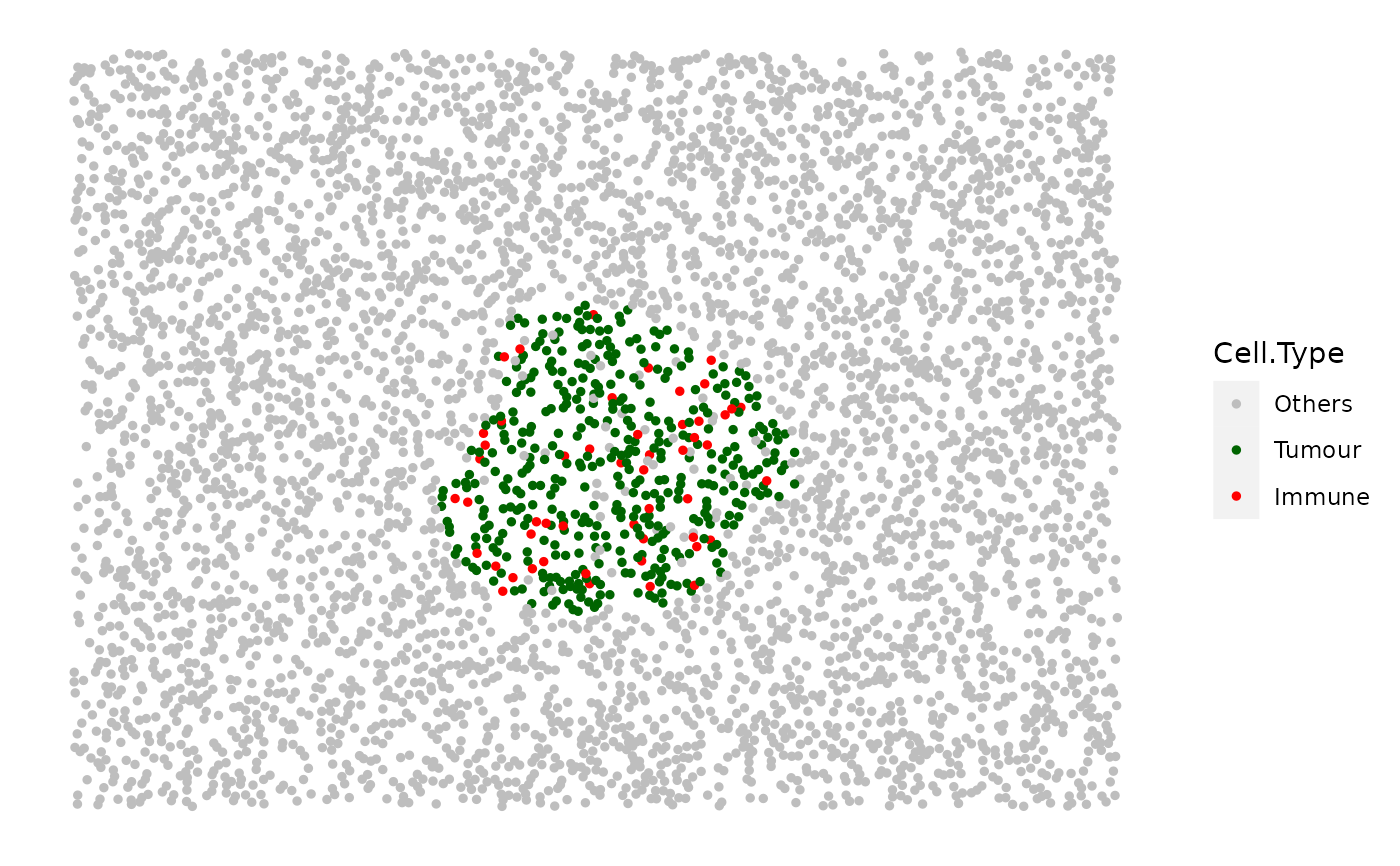
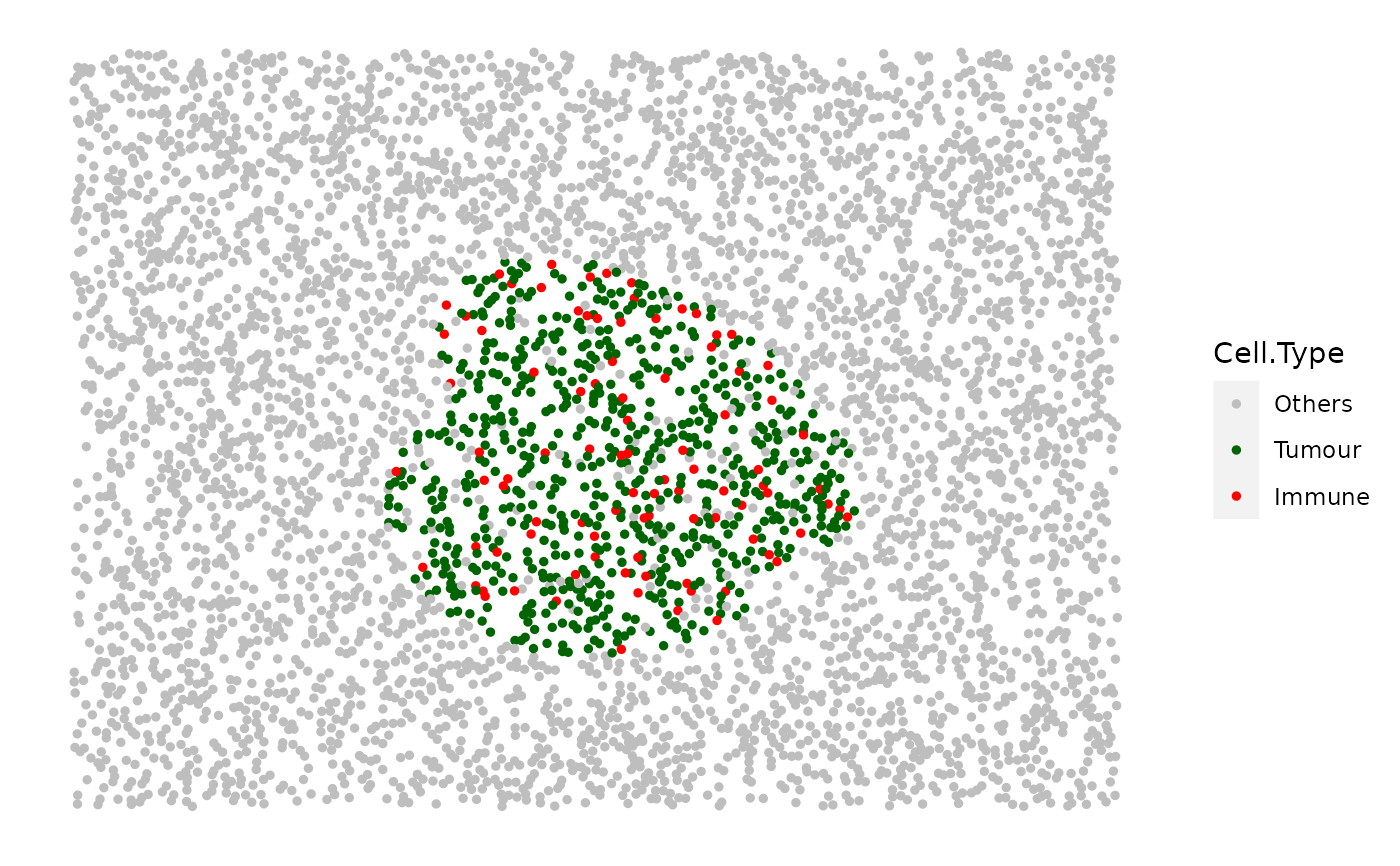
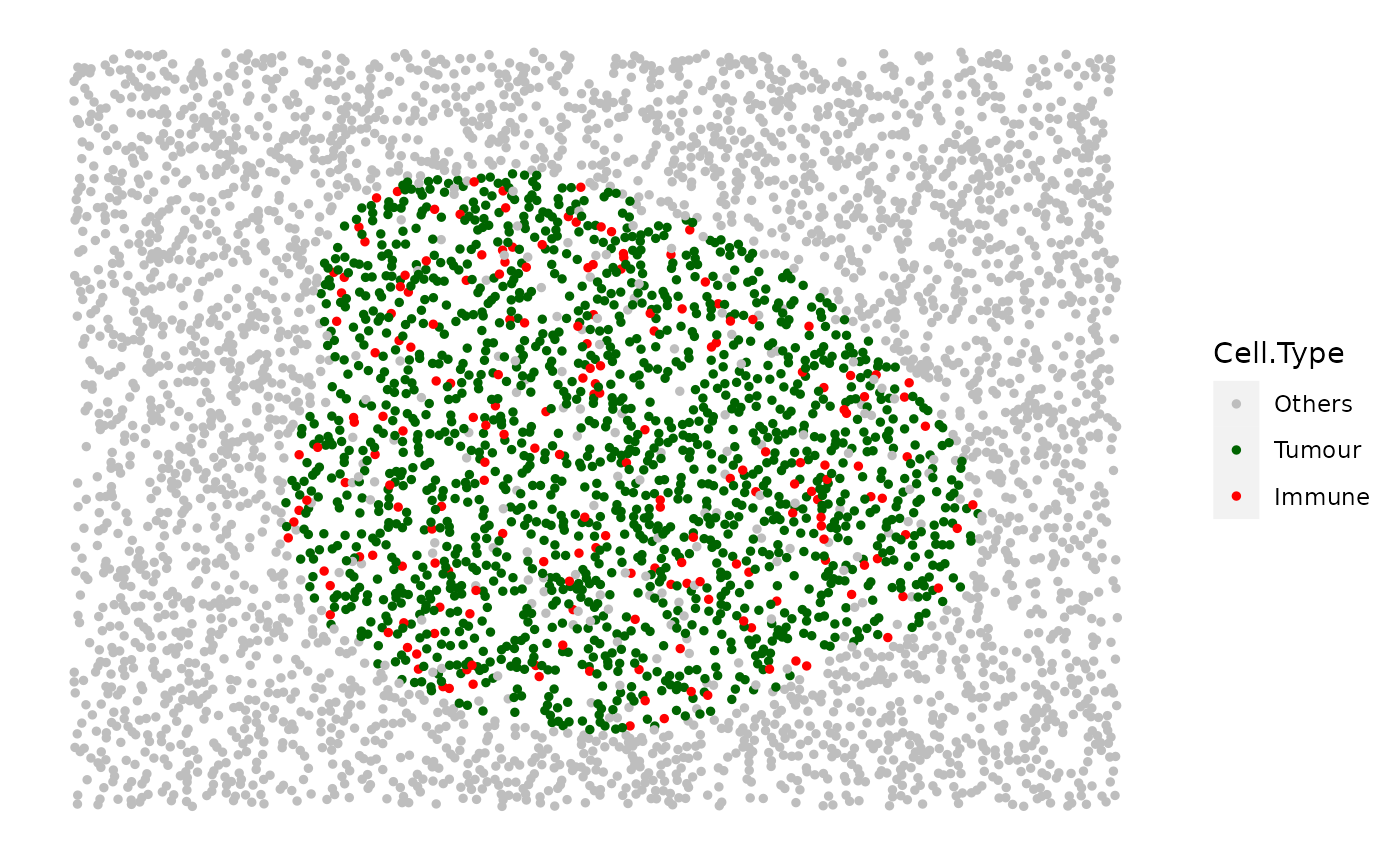
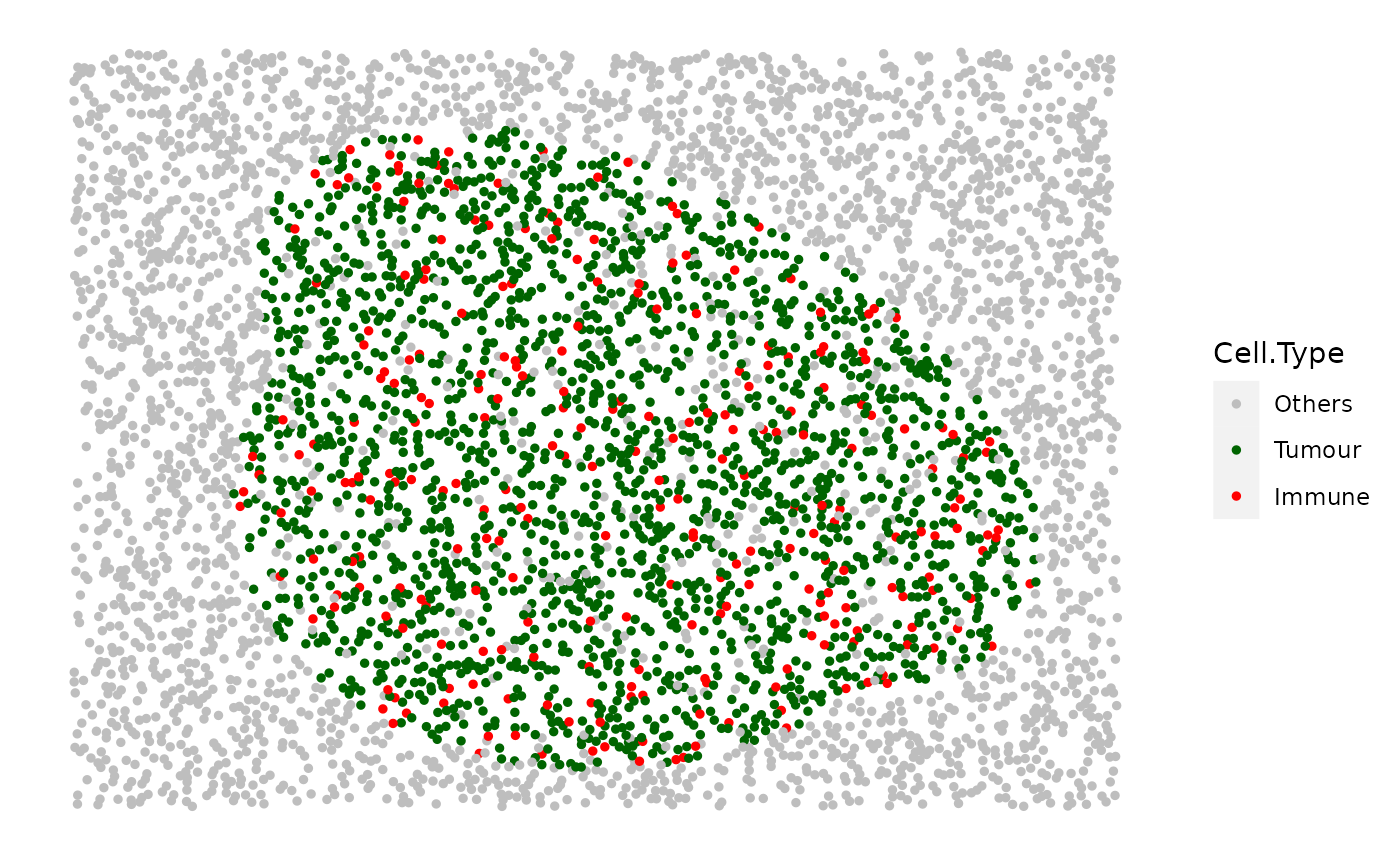
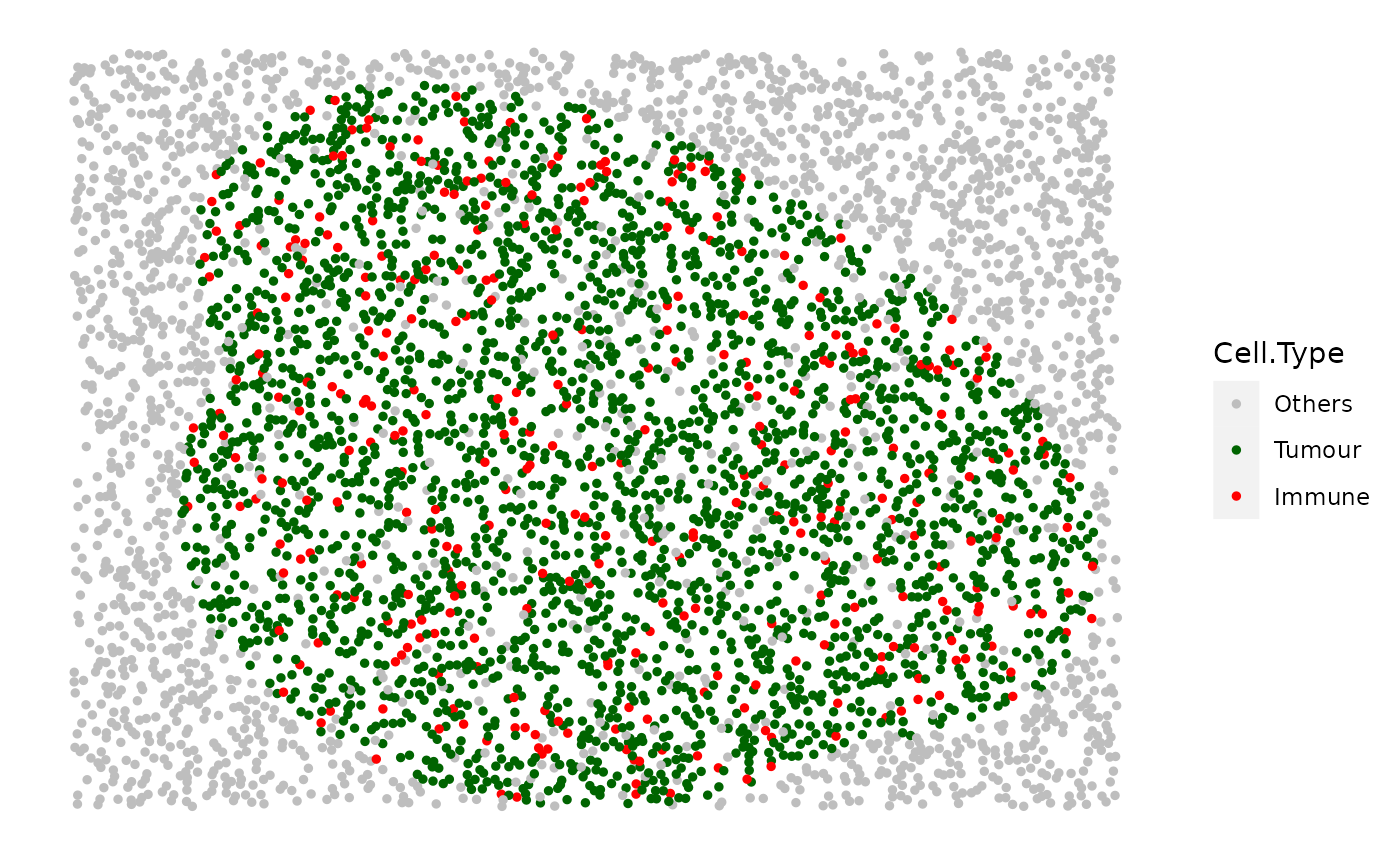
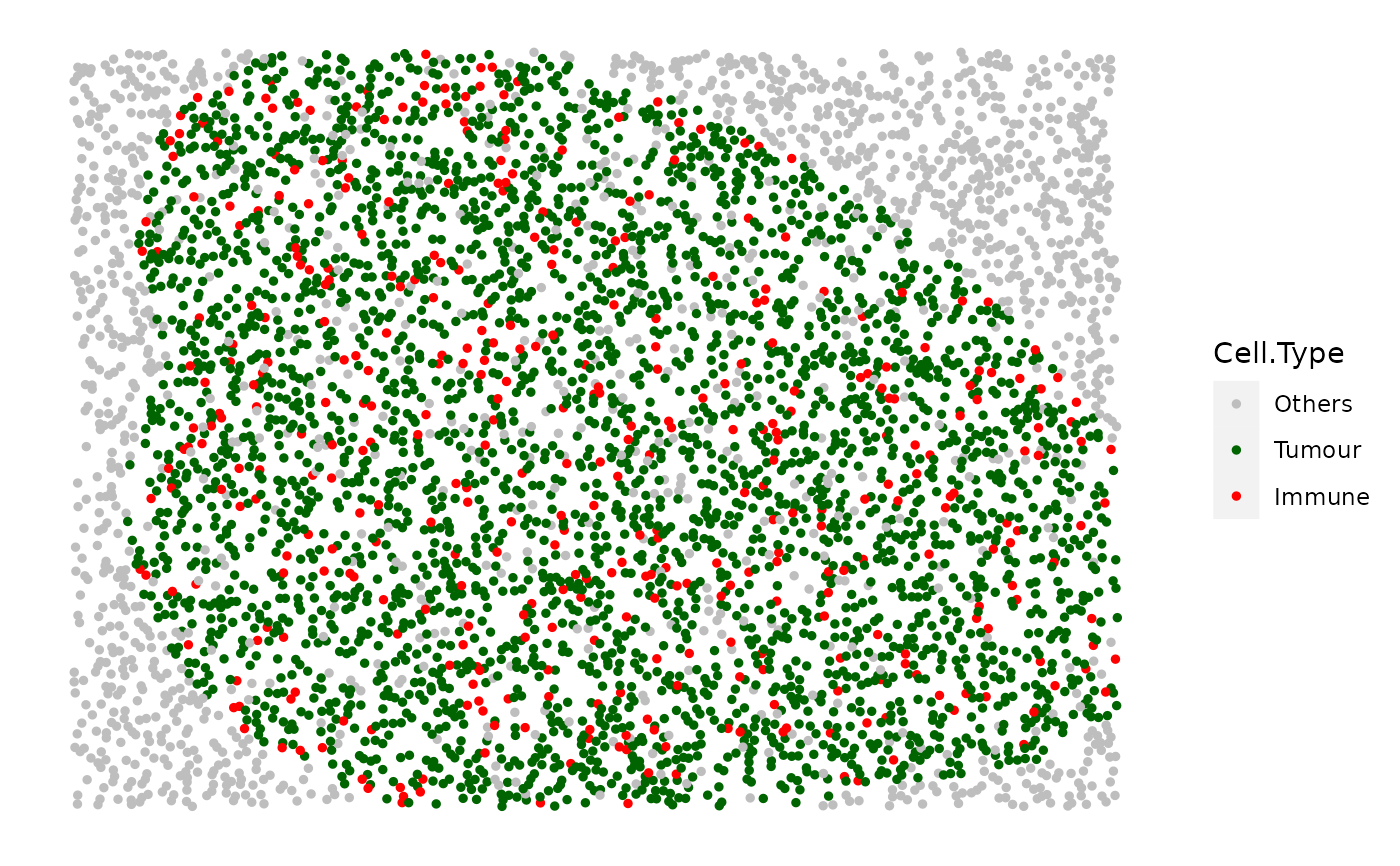
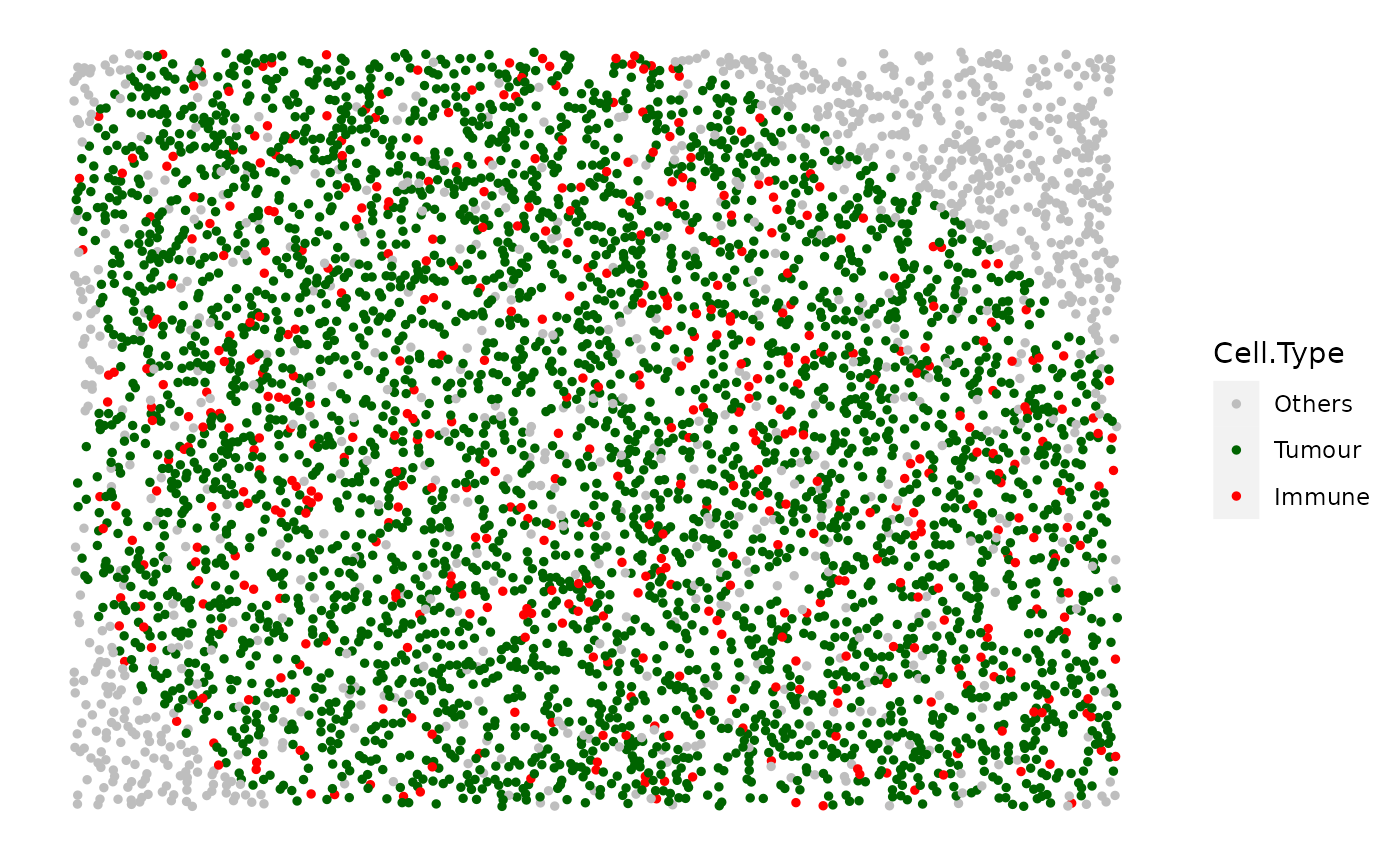
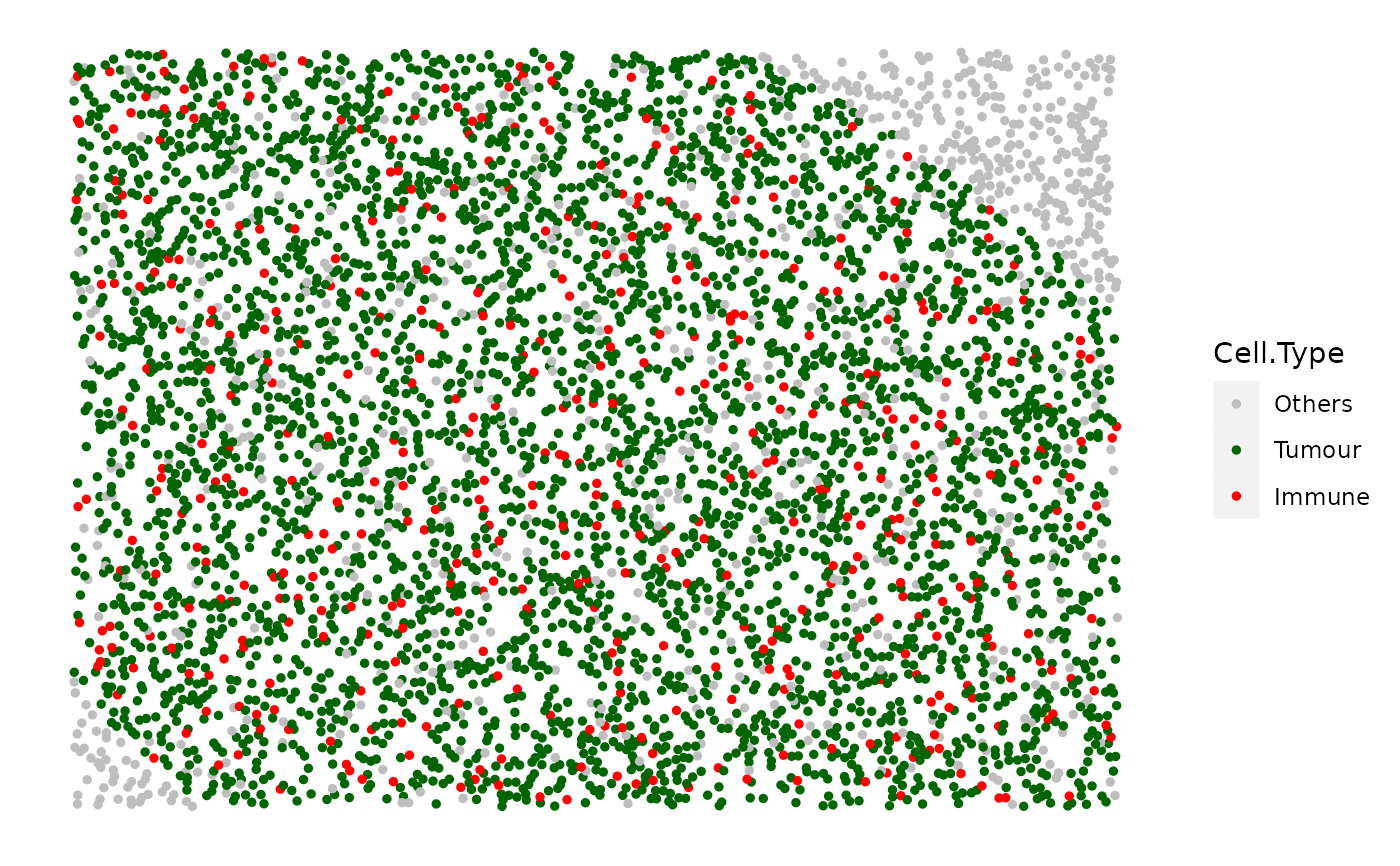
Simulate multiple images with clusters
multiple_images_with_clusters.RdGenerate a set of images with different cluster properties. Trying out the default parameters is recommended for understanding this function. The default values for the arguments give an example of multiple image simulation which enable an automatic multiple image simulation without the specification of any argument.
multiple_images_with_clusters(
  bg_sample = bg1,
  cluster_shape = 2,
  prop_infiltration = 0.1,
  cluster_size = seq(200, 1000, 100),
  cluster_loc_x = 0,
  cluster_loc_y = 0,
  plot_image = TRUE,
  plot_categories = NULL,
  plot_colours = NULL
)
Arguments
- bg_sample
A data frame or
SpatialExperimentclass object with locations of points representing background cells. Further cell types will be simulated based on this background sample. The data.frame or thespatialCoords()of the SPE object should have colnames including "Cell.X.Positions" and "Cell.Y.Positions". By default use the internalbg1background image.- cluster_shape
Number. Choose from one of the following pre-designed shapes (1 or 2 for tumour cluster or 3 for immune cluster). The pre-designed shape contains information of the cell names of the cluster, the infiltration cell types, the proportions of infiltration, the cluster size, and the cluster centre locations. In order to simulate a set of images, use the arguments below to specify the ranges of the properties. The predefined cell types can not be changed, while users can change them manually after the simulation.
- prop_infiltration
Numeric Vector. The degree of infiltration. If numeric, all simulated images have the same infiltration degree. If vector, images with a range of different infiltration proportions will be simulated.
- cluster_size
Numeric Vector. The size of the cluster. If numeric, all simulated images have the same cluster size. If vector, images with a range of different cluster sizes will be simulated. The size should not exceed the limit of the image sides.
- cluster_loc_x
Numeric or Vector. The X location of the cluster center offset. If numeric, all simulated images have the same center X location. If vector, images with a range of different center locations will be simulated.
- cluster_loc_y
Numeric or Vector of the same length of
cluster_loc_x. The Y location of the cluster center offset.- plot_image
Boolean Whether plot the simulated images or not.Default is TRUE.
- plot_categories
String Vector specifying the order of the cell categories to be plotted. Default is NULL - the cell categories under the "Cell.Type" column would be used for plotting.
- plot_colours
String Vector specifying the order of the colours that correspond to the
plot_categoriesarg. Default is NULL - the predefined colour vector would be used for plotting.
Value
A list of SPE objects
See also
multiple_background_images for simulating multiple
mixed background images, and
multiple_images_with_immune_rings for simulating multiple
images with immune rings.
Other simulate multiple images functions:
multiple_background_images(),
multiple_images_with_immune_rings()