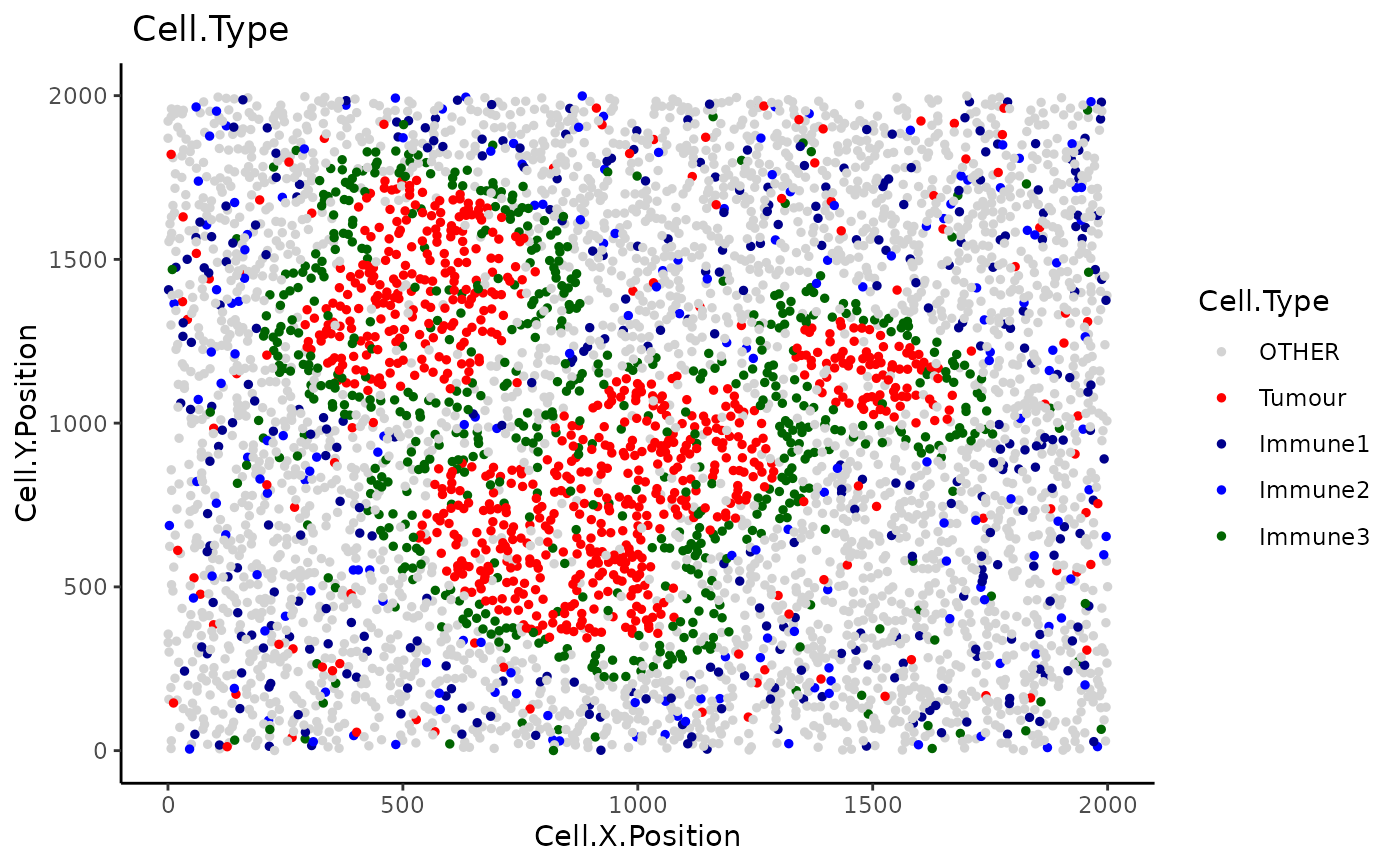
Produces a scatter plot of the cells of their x-y positions in the tissue. Cells are coloured categorically by phenotype. Cells not part of the phenotypes of interest will be coloured "lightgrey".
plot_cell_categories(
  spe_object,
  categories_of_interest = NULL,
  colour_vector = NULL,
  feature_colname = "Cell.Type",
  cex = 1,
  layered = FALSE
)
Arguments
- spe_object
SpatialExperiment object in the form of the output of
format_image_to_spe.- categories_of_interest
Vector of cell categories to be coloured.
- colour_vector
Vector specifying the colours of each cell phenotype.
- feature_colname
String specifying the column the cell categories belong to.
- cex
Numeric. The size of the plot points. Default is 1.
- layered
Boolean. Whether to plot the cells layer by layer (cell categories). By default is FALSE.
Value
A plot is returned
Examples
categories_of_interest <- c("Tumour", "Immune1","Immune2","Immune3")
colour_vector <- c("red","darkblue","blue","darkgreen")
plot_cell_categories(SPIAT::defined_image, categories_of_interest, colour_vector,
feature_colname = "Cell.Type")