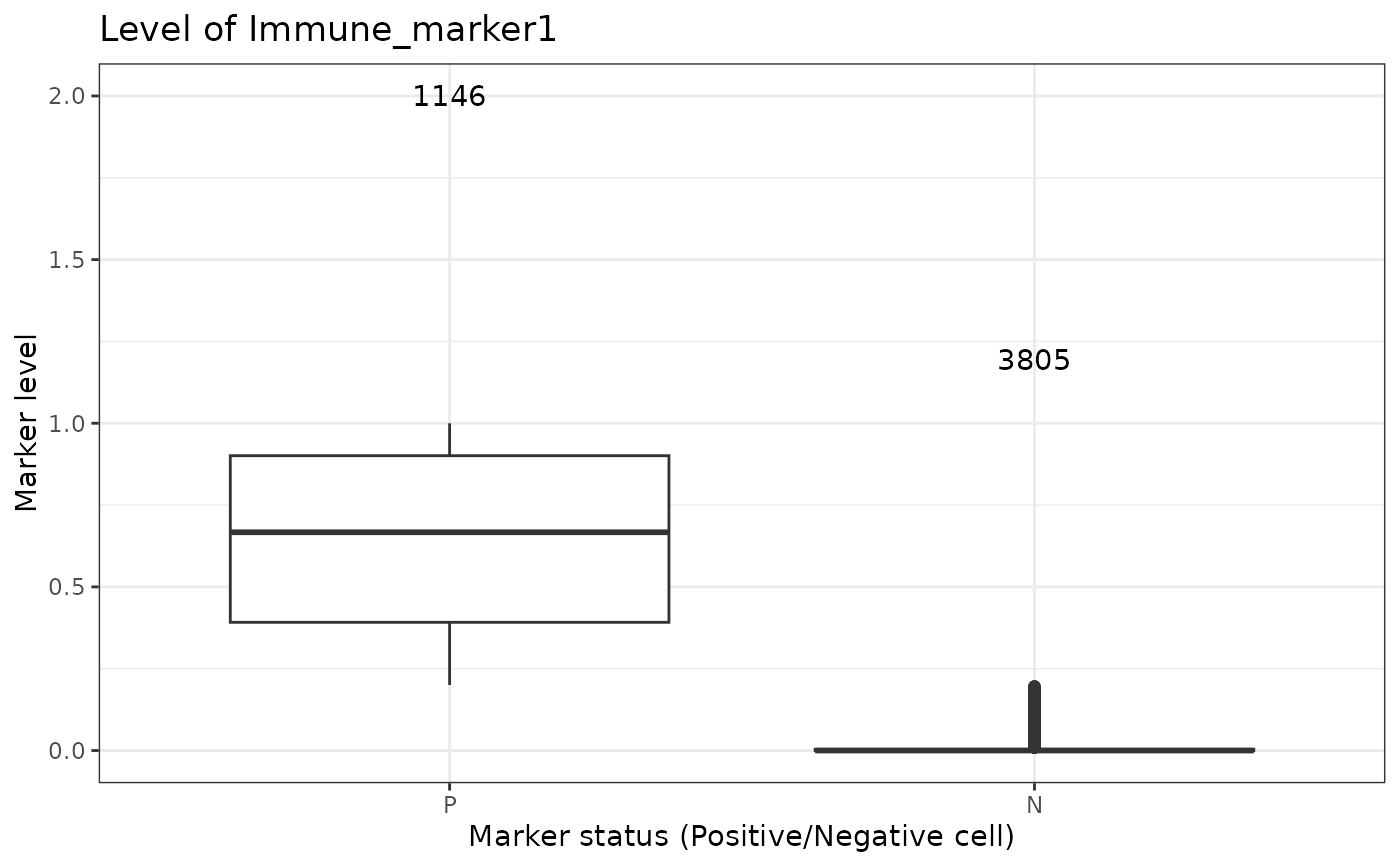
Produces boxplots of marker levels for cells phenotyped as being positive for the marker, and those that where phenotyped as being negative.
marker_intensity_boxplot(spe_object, marker, feature_colname = "Phenotype")Arguments
- spe_object
SpatialExperiment object in the form of the output of
format_image_to_spe.- marker
String. Marker being queried.
- feature_colname
String. Column containing marker information
Value
A plot is returned
Examples
marker_intensity_boxplot(SPIAT::simulated_image, "Immune_marker1")