Uses Euclidean distances to identify neighborhoods of cells. Three clustering methods are available, including hierarchical clustering, dbscan, and Rphenograph (Note: While Rphenograph option cannot be run directly in this package, the code is available and commented out.)
identify_neighborhoods(
  spe_object,
  method = "hierarchical",
  cell_types_of_interest,
  radius,
  min_neighborhood_size = 10,
  k = 100,
  feature_colname,
  no_pheno = NULL
)
Arguments
- spe_object
SpatialExperiment object in the form of the output of
format_image_to_spe.- method
String. The clustering method. Choose from "hierarchical", "dbscan" and "Rphenograph". (Note Rphenograph function is not available for this version yet).
- cell_types_of_interest
String Vector of phenotypes to consider.
- radius
Numeric specifying the radius of search. Need to specify when `method` is "hierarchical" or "dbscan".
- min_neighborhood_size
Numeric. The minimum number of cells within each cluster. Need to specify when `method` is "hierarchical" or "dbscan".
- k
Numeric. The parameter for "Rphenograph" method.
- feature_colname
String. Column from which the cell types are selected.
- no_pheno
Cell type corresponding to cells without a known phenotype (e.g. "None", "Other")
Value
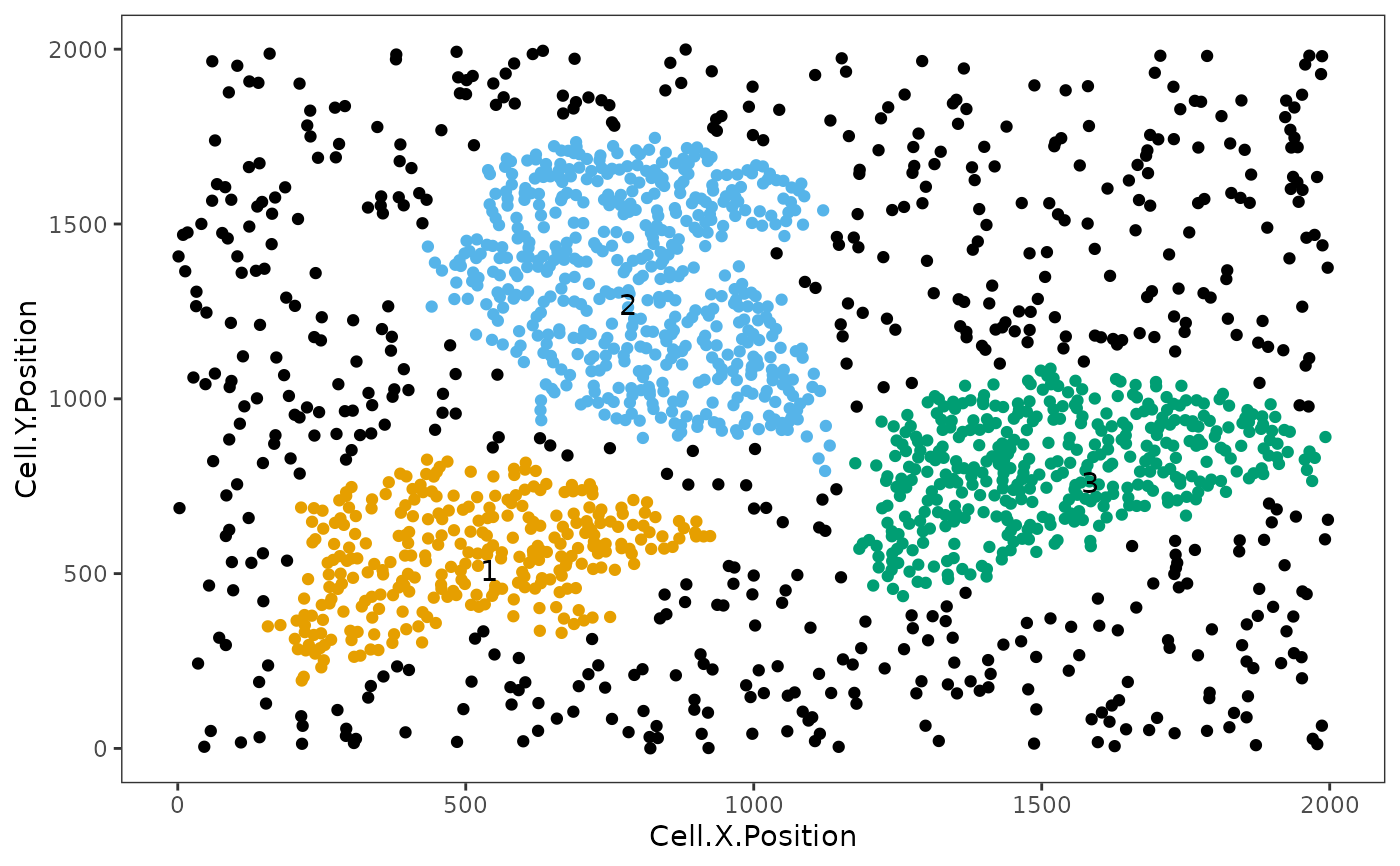
An spe object and a plot is returned. The spe object contains information of the defined neighborhood under "Neighborhood" column. The cells of interest that do not form clusters are labelled "Free_cell", cells not of interest are labelled `NA`.
Examples
neighborhoods <- identify_neighborhoods(image_no_markers, method = "hierarchical",
min_neighborhood_size = 100, cell_types_of_interest = c("Immune", "Immune1", "Immune2"),
radius = 50, feature_colname = "Cell.Type")