Dimensionality reduction plot
Source:R/dimensionality_reduction_plot.R
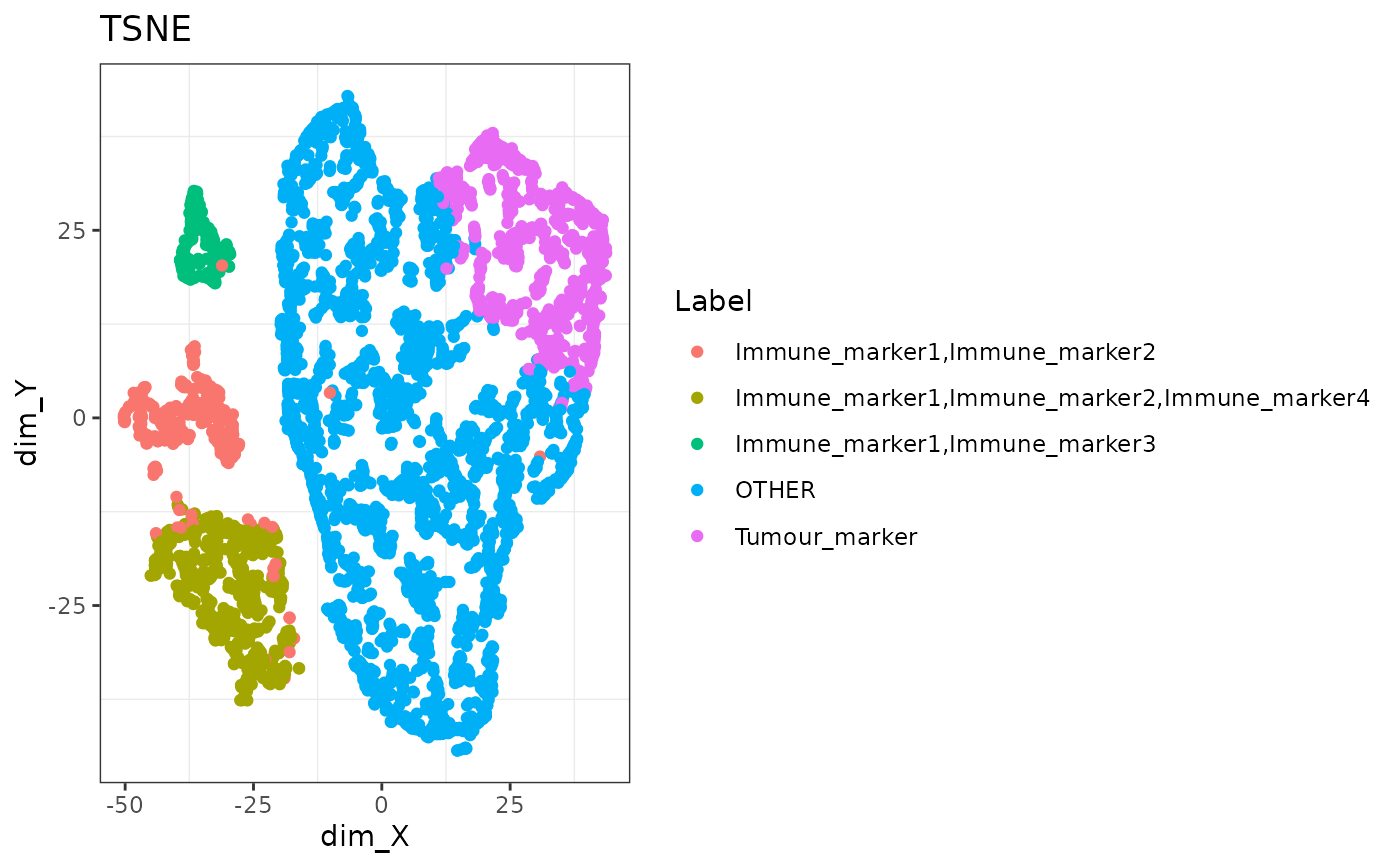
dimensionality_reduction_plot.RdGenerates the dimensionality reduction plots (UMAP or tSNE) based on marker intensities. Cells are grouped by the categories under the selected column.
dimensionality_reduction_plot(
  spe_object,
  plot_type = "UMAP",
  scale = TRUE,
  perplexity = 30,
  feature_colname
)
Arguments
- spe_object
SpatialExperiment object in the form of the output of
format_image_to_spe.- plot_type
String. Choose from "UMAP" and "TSNE".
- scale
Boolean. Whether scale the marker intensities.
- perplexity
Numeric. Perplexity parameter of the Rtsne function (should be positive and no bigger than 3 * perplexity < n - 1, where n is the number of cells).
- feature_colname
String. Specify the column name to group the cells.
Value
A plot
Examples
dimensionality_reduction_plot(SPIAT::simulated_image, plot_type = "TSNE",
feature_colname = "Phenotype")